I commonly see people running a site speed test through GTMetrix or Google PageSpeed Insights and panic when they receive a “bad” score. However, in most cases, the score does not directly relate to how quickly your website actually loads.
A great example of this can be seen with the following two sites (site URLs hidden for privacy):
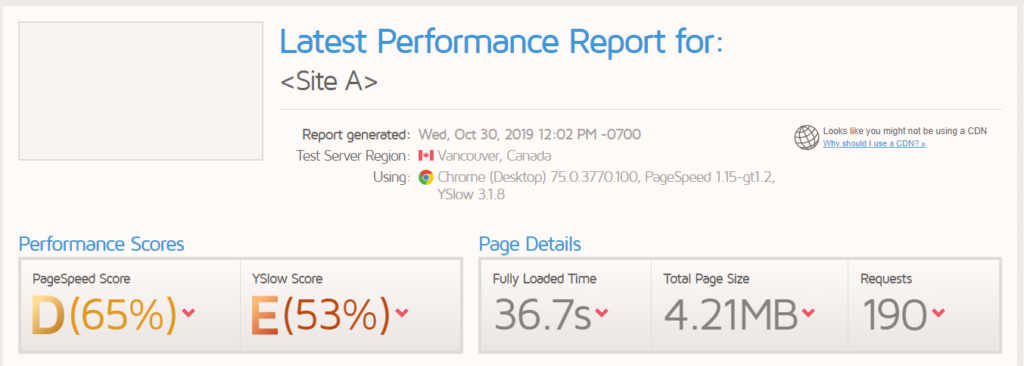
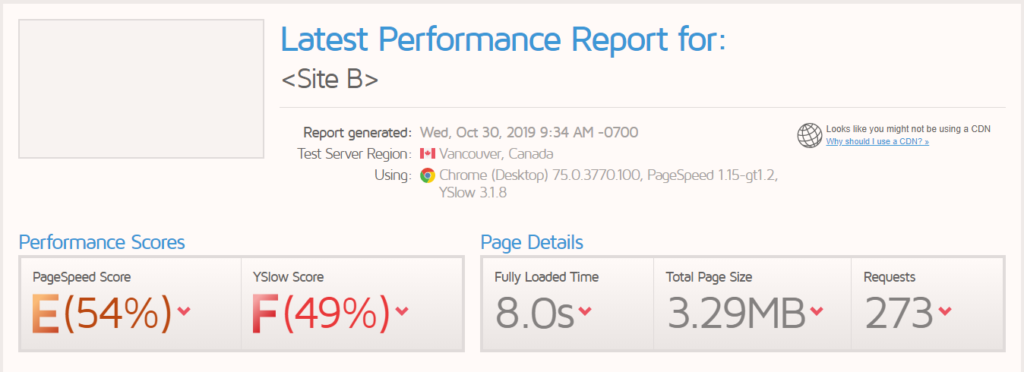
Notice how Site A has a large load time of 36.7 seconds, receiving a D score, while Site B loads four timers quicker at 8 seconds with a worse score of E.
What does the score mean then?
GTMetrix (and indeed most site speed scores) are used to indicate the number of areas in which your site can be optimized. That does not mean these issues even affect site speed at all!
The main purpose of the issues shown in GTMetrix is to help your identify where your site can be improved, not so much as the cause of a long page load time.
To prove that further, let’s take a look at my mom’s ecommerce website, hosted with Shopify. Here’s what normal report looks like, with no additional settings set (just entered the URL and hit analyze):
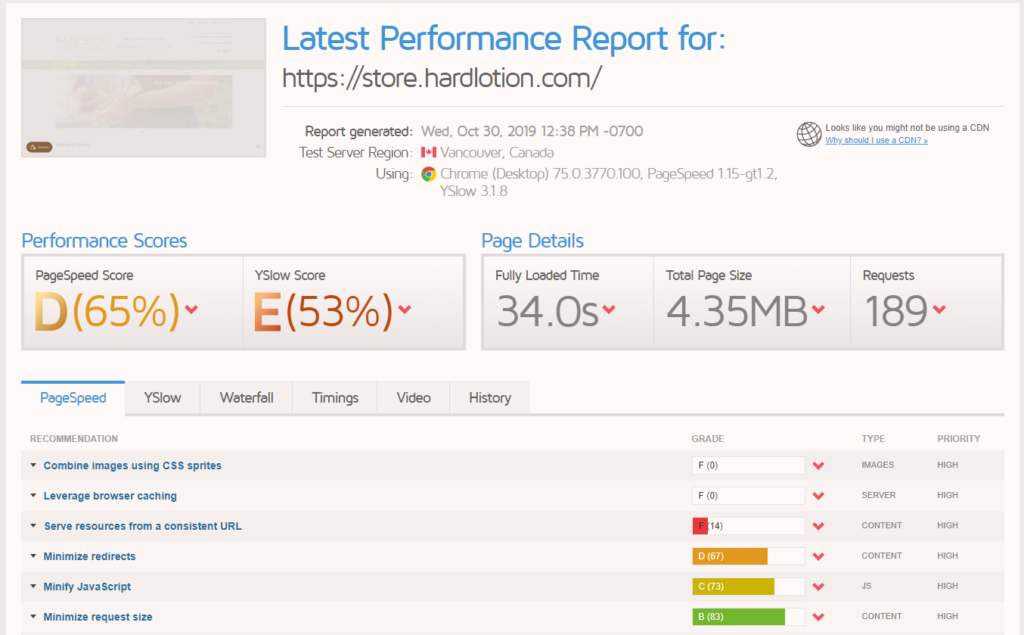
There are several issues with the report here, and most people would understandably get upset seeing the same thing on their website.
First, there’s the insane load time of 34 seconds. If you visit the website, you’ll notice you won’t be looking at a blank loading screen for 30 seconds. So why the high loading time?
Fully loaded time is just that, the time it takes to *fully* load the page. However, as you may have noticed visiting most sites, some content loads before other content. If you have a really sharp eye, you may notice small things like social media icons load in quite awhile after the website has loaded.
These things are done to ensure that everything important is loaded first, then the less important items will load in after. This is especially important as visual items can take longer to load than the mots important text on your website.
Primary vs Secondary Content
Report tools like GTMetrix cannot tell the difference between primary content and secondary content. Primary content will be your theme, it’s styling, and the text of the page or post you’re viewing. Secondary content are usually social share buttons (they take longer to load then you’d think), some sidebar content, images, and ads (we’ll get to that last one later).
Primary content is also sometimes called “above the fold” content.
This means that while your website has loaded pretty much everything of value to reader, it may take awhile longer to load the rest of the content.
Circling back to my mom’s website and the shocking load time of 34 seconds, let’s figure out how we can tell what the real load time of the website homepage is.
The first way to do this is to simply visit the page in question and count the seconds it takes to load the site. Loading store.hardlotion.com, it takes roughly four seconds to the point where I’m able to recognize the layout of the website, and scroll down to see the text. It takes a second or two more for the YouTube video at the top of the page to load.
Of course, this does depend on other factors. Mainly, your own internet speed, and the fact that some content may be cached. However, we can use a tool in GTMetrix which will record a video the page loading, along with an overlayed stopwatch timer. This will let you decide for yourself exactly how many seconds it takes for your site to be considered “loaded”.
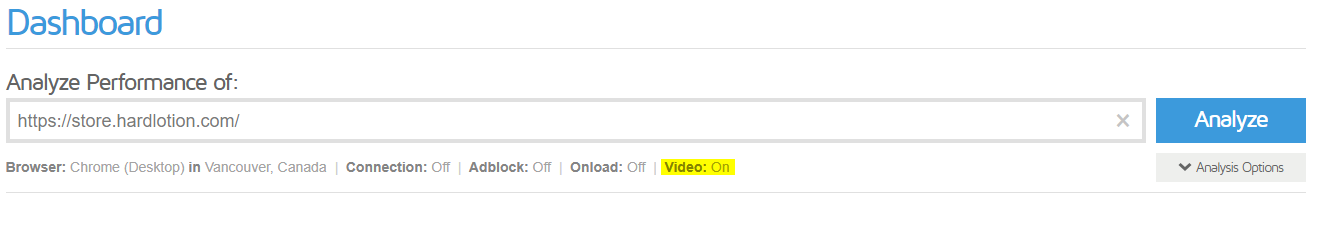
To use this feature, you will need to create a GTMetrix account. This is free, and I highly recommend you do this as it also allows you to save and keep track of reports you run. Then, before you run the report, you can enable the “Video”.
After the report has finished running, you can go to the Video tab to view it. Here’s the video from the report on store.hardlotion.com:
I would judge the page to be loaded at around the 7 second mark. Unfortunately you can’t tell in this video, but the text below the YouTube video likely loads much sooner. In my personal opinion I don’t think it’s a good idea to put a YouTube video like that above other content, since YouTube videos can take quite a long time to load.
Conclusion
Tools like GTMetrix should help you identify areas in which you can improve, as well as help you accurately tell how long it takes for a page to load. However, it’s not good to be obsessed with the score they give you. It’s my opinion that a score is given, because there isn’t any non-technical way for them to grade you on site performance based on issues they find.
You should always look at the time it takes for your website to load. If GTMetrix says 30 seconds, and you load your site within 5, it’s safe to say GTMetrix isn’t reporting something accurately.